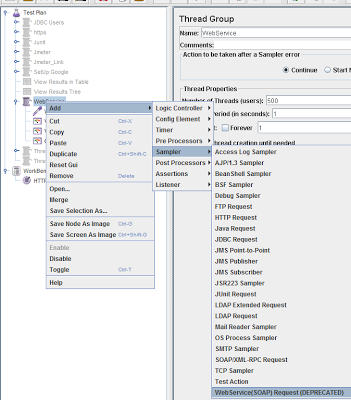
1. Create Thread Group for Web Service as below:
Add->Sampler->WebService(SOAP) Request
(DEPRECATED)
+Step by step such as:
-
We have a link: http://www.webservicex.com/globalweather.asmx?wsdl
-
Input that link into WSDL URL
-
Click [Load WSDL] button
-
Selected item [GetWeather] from Web Methods
-
Click [Configure] button
3.
Copy that code into Jmeter and checked [Read
SOAP Response]
<soapenv:Envelope xmlns:soapenv="http://schemas.xmlsoap.org/soap/envelope/"
xmlns:web="http://www.webserviceX.NET">
<soapenv:Header/>
<soapenv:Body>
<web:GetCitiesByCountry>
<!--Optional:-->
<web:CountryName>?</web:CountryName>
</web:GetCitiesByCountry>
</soapenv:Body>
</soapenv:Envelope>
4.
Add Listener:
Thread
Group->Add->Listener->Response Time Graph/View Results Tree/ View Results
in Table
5. Save Thread Group and run it, we will have
result as below:
6. The parameters at the bottom of the chart have
the following meaning:
Average is the total time running divided by number of requests sent to the server.
Median is the number that represents the time, where half of server response time is lower than this number and half is higher.
Deviation shows how much the server response time varies, a measure of degree of dispersion, or, in other words, how spread the data are.
Latest sample is just the last request completed.
HoaLe


No comments:
Post a Comment